Spectrum Analyzer
See also: About the spectrum analyzer, Interference detection, and Spectrum Analyzer example screens
Features:
-
Can monitor all seven GNSS bands
-
Monitors continuously in the background
-
Can playback previous days' data in waterfall or filtered format
-
Can display real-time data in waterfall, filtered, peak hold, or unfiltered formats
-
Does not affect the current functions such as logging, corrections generation, or observables streaming
NOTE – As of version 5.37, the Alloy spectrum analyzer has several improvements: faster update rates up to 5 Hz are supported; y-axis display (power in dB) scaling has been improved; the FFT (Fast Fourier Transform) can better detect more external pulse interference with reduced noise without requiring filtering. T04 files can save analyzed logs of the spectrum analyzer.
TIP – To view the history of the spectrum analyzer, you must enable data logging in the T04 format.
To open the Spectrum Analyzer, select Receiver Status / Spectrum Analyzer.
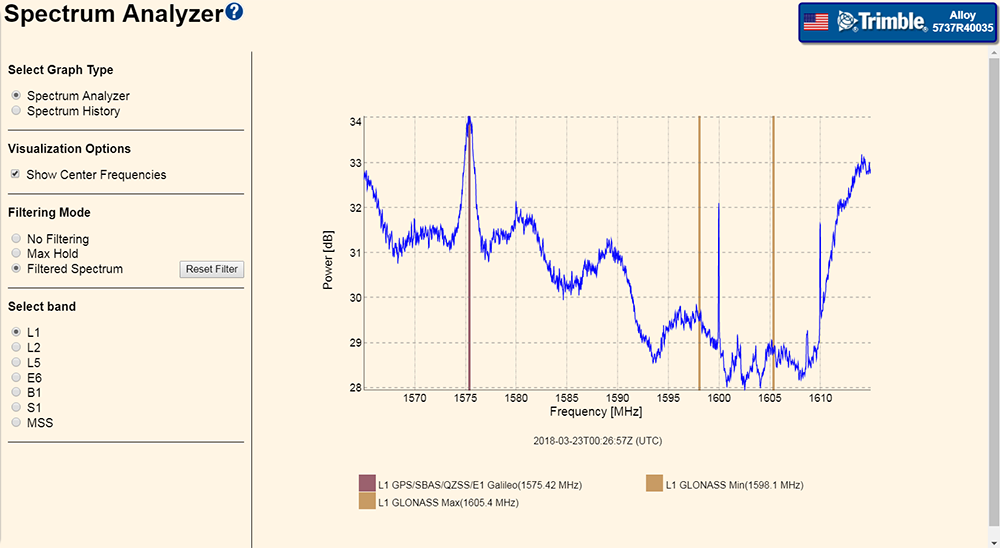
The screen is divided into the following sections:
-
Select Graph Type – Spectrum Analyzer mode or Spectrum History mode.
-
Select File – This option is present only in Spectrum History mode.
-
Select band – Select the frequency band of the satellite that you want to view.
-
Visualization Options – Select the type of graph you want to view.
-
Filtering Mode – This option is present only in Spectrum Analyzer mode.
-
The main graph window.
For more information, see below.
Select Graph Type – You can select between an amplitude-verses-frequency (in dB) or a time-verses-frequency in waterfall format. The waterfall format also contains amplitude information presented as colors.
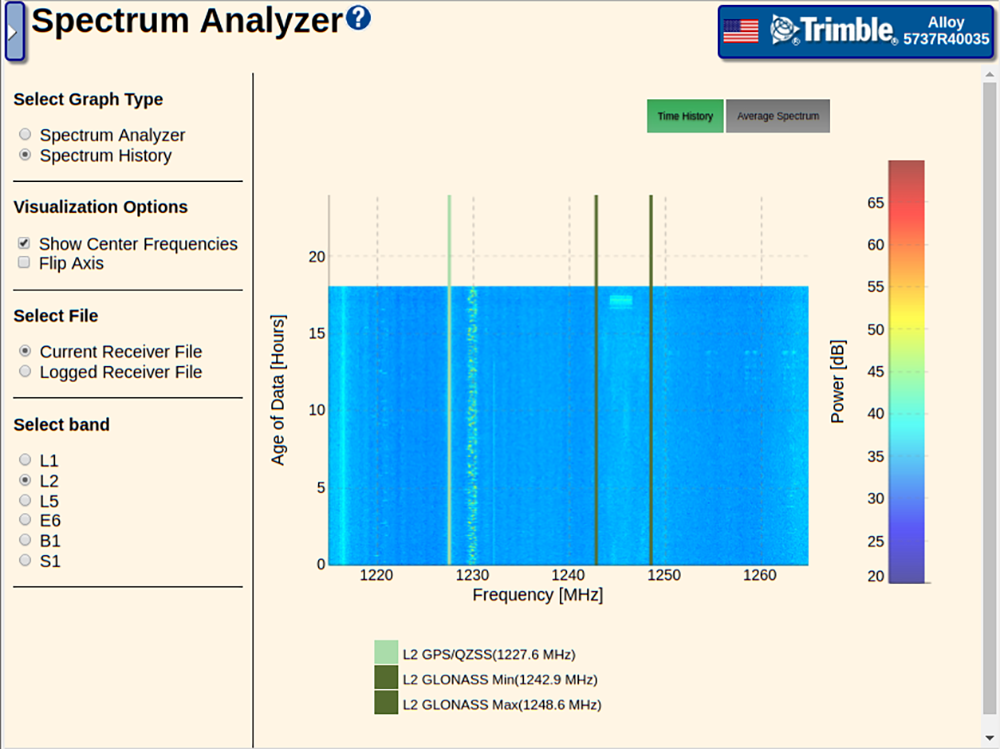
In the waterfall format, the Visualization Options allow for the axis to be flipped so that the frequency is on the Y axis and time is on the X axis
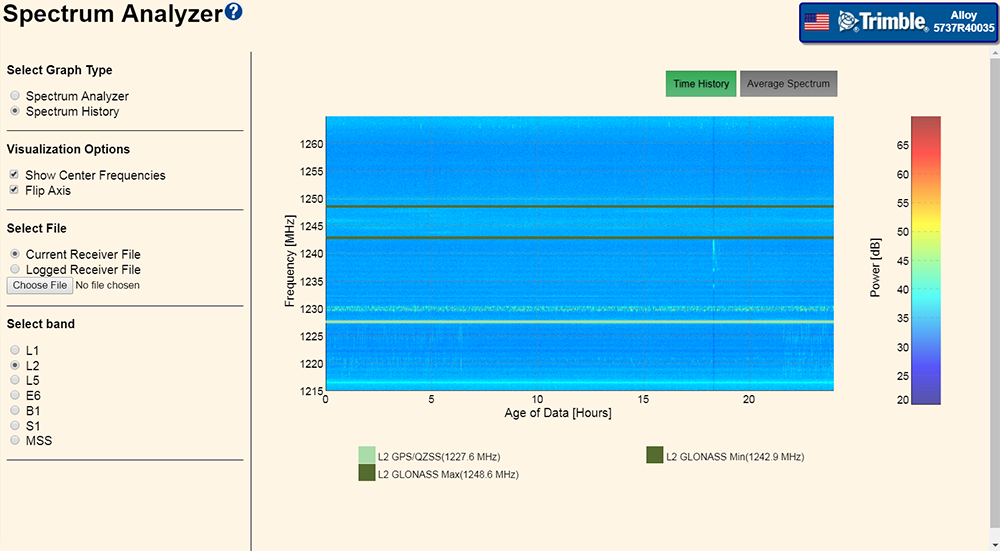
In Spectrum History mode, additional Visualization Options are available:
-
TIme History
-
Average Spectrum
-
3D TIme History
-
Show Center Frequencies
-
Flip Axis
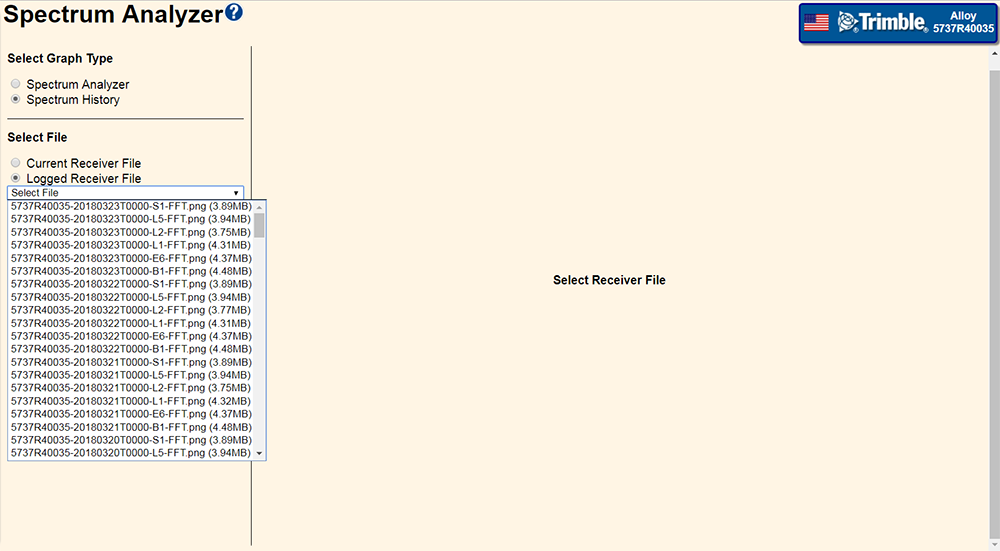
Select File – This option is present only in the Spectrum History mode. It enables you to choose between the current day's data, including the near real-time observations or the previous days' data.
The amount of history file held in the receiver depends on the amount of available memory in the receiver. Typically, the receiver can store about three months of FFT 'png' files, however; if the user memory becomes full (due to the user not enabling the Auto-Delete function) the spectrum analyzer will not be able to store any files until some user memory is released.
NOTE – The auto-delete and management of the spectrum analyzer historical files is automatic; you cannot adjust this. It does not in any way affect user T02/T04 files.
In the Spectrum History mode, the display can be set to Time History or Average Spectrum. The Average Spectrum mode is similar to the Filtered Spectrum when in Spectrum Analyzer mode as described below.
When in Spectrum Analyzer mode, there are three selections available for the filtering mode:
-
No Filtering – In this mode, the spectrum analyzer passes the raw data sampled to the display. This is useful for attempting to catch transient type signals such as radars.
-
Max Hold – In this mode, the spectrum analyzer uses the unfiltered dataset but allows any samples that exceed the maximum to be displayed. This is again useful to catch transient type signals but is of no use to measure the duration or repetition rate of the transient signals.
-
Filtered Spectrum – The default mode of the display. It uses low pass data-filtering to filter the FFT data to display. If you click Reset, these data-filters are cleared and the data will initially resemble the No Filtering mode until the filter values are rebuilt.
Select band – Select which frequency band to display:
|
Band |
Start |
Stop |
BW |
Center |
Signals |
|---|---|---|---|---|---|
|
L1 |
1.5650 GHz |
1.6150 GHz |
50.0000 MHz |
1.5900 GHz |
L1 GPS/SBAS/QZSS/E1 Galileo (1575.42 MHz) L1 GLONASS Min (1598.1 MHz) L1 GLONASS Max (1605.4 MHz) |
|
L2 |
1.2150 GHz |
1.2650 GHz |
50.0000 MHz |
1.2400 GHz |
L2 GPS/QZSS (1227.6 MHz) L2 GLONASS Min (1242.9 MHz) L2 GLONASS Max (1248.6 MHz) |
|
L5 |
1.1650 GHz |
1.2150 GHz |
50.0000 MHz |
1.1900 GHz |
L5 GPS/QZSS/SBAS/NavIC/E5A Galileo (1176.45 MHz) E5B Galileo/B2 BeiDou-II (1207.6 MHz) E5 AltBOC Galileo (1191.795 MHz) G3 GLONASS CDMA (1202.025 MHz) |
|
E6 |
1.2550 GHz |
1.3050 GHz |
50.0000 MHz |
1.2800 GHz |
E6 Galileo/LEX QZSS (1278.75 MHz) B3 BeiDou-II (1268.52 MHz) |
|
B1 |
1.5250 GHz |
1.5750 GHz |
50.0000 MHz |
1.5500 GHz |
B1 BeiDou-II (1561.098 MHz) |
|
S1 |
2.4780 GHz |
2.5280 GHz |
50.0000 MHz |
2.5030 GHz |
NavIC S BAND (2492.028 MHz) |
|
MSS |
1.525 GHz |
1559 MHz |
50.0000 KHz |
MSS - The MSS spectrum start/stop are changed depending on the MSS downlink that the receiver is set to track. The receiver can receive MSS signals anywhere in the 1525 to 1559 MHz MSS band; only a 50 KHz spectrum is shown around the desired signal. |
The L1-S1 bands are all 50 MHz wide while the MSS band is 50 KHz wide. The bands are individually observable in the following modes:
-
Near real-time filtered
-
Near real-time maximum hold
-
Near real-time unfiltered
-
Near real-time in waterfall format
-
Historical in averaging format
-
Historical in waterfall format (not supported for MSS)
Graph manipulations
The following mouse control manipulations are supported in the amplitude verses frequency and time verses frequency (water fall) displays:
-
Readout of signal level and frequency via mouse hovering (amplitude vs. frequency)
-
Readout of signal level, frequency and time via mouse hovering (time vs. frequency)
-
Frequency axis expansion (magnification)
-
Amplitude axis expansion (magnification)
-
Time axis expansion (magnification)
To magnify whatever is on the Y axis:
-
Place the mouse on the desired area of the graph.
-
Press down the left mouse button and hold it while dragging the mouse vertically up or down as required. A shadow of the area to be magnified will be displayed.
-
Release the left mouse button. The area is now magnified.
-
To return to the default display, place the mouse anywhere on the graph and double-click the left mouse button.
To magnify whatever is on the X axis:
-
Place the mouse on the desired area of the graph.
-
Press down the left mouse button and hold it while dragging the mouse horizontally left or right as required. A shadow of the area to be magnified will be displayed.
-
Release the left mouse button, the area is now magnified.
-
To return to the default display, place the mouse anywhere on the graph, double-click the left mouse button, the graph will return to default.
To read the signal strength and frequency (and the time if in waterfall mode) directly off the cursor position on the graph:
-
Place the mouse on the desired part of the spectrum analyzer graph.
-
Read the frequency and amplitude (and the time if in waterfall mode) off the dark display box above the left side of the graph.
-
The signal strength and amplitude also work if the graph has been magnified.
Signal derivation
The various signal bands are all processed in a similar manner. The L1 band processing is shown in this example:
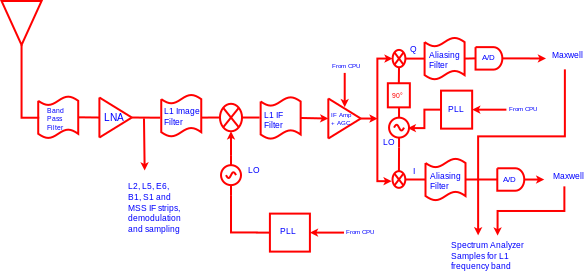
Down conversion and IF processing are done before the In-phase and Quadrature-phase demodulation. The outputs of the I/Q demodulation are fed into an aliasing filters before sampling at the A/Ds. The outputs of the A/D units are fed to the Maxwell ASICs for correlation and onward processing by the system CPU. A small sampling from the Maxwell ASICs (~1% of all total samples) is used by the system to produce the spectrum analyzer display. It is this technique of using only a subset of the sampled data that allows the receiver to maintain normal operation while simultaneously performing the spectrum analyzer function.
Spectrum Analyzer uses
The spectrum analyzer is meant as a site evaluation tool in addition to other tools such as teqc (see www.unavco.org/software/data-processing/teqc/teqc.html). The spectrum analyzer is meant as a compliment to these tools and not a replacement.