Spectrum Analyzer example screens
See also: Interference detection and About the spectrum analyzer
Example 1
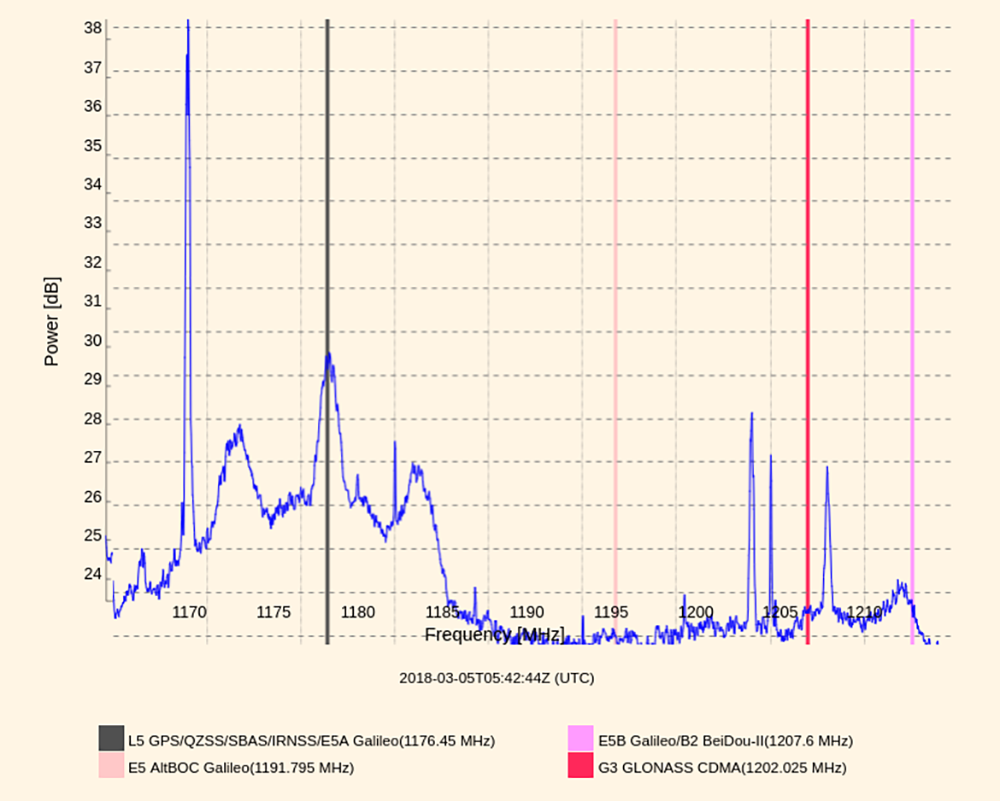
This example shows the L5 frequency band located in the Trimble Singapore office. Notice some of the frequency spikes. The table beneath lists the local airports in the vicinity (within ~50 miles) with their associated VOR and DME(TACAN) frequencies. Pay particular attention to the DME(TACAN) transmit frequency.
|
Site |
VOR channel |
DME Rx channel |
DME Tx channel |
Visible (~dB) |
|---|---|---|---|---|
|
SaintJon |
113.50 MHz |
1,106 MHz |
1,169 MHz |
+38.5 |
|
Tekong |
116.50 MHz |
1,136 MHz |
1,199 MHz |
+28.2 |
|
Seletar |
115.10 MHz |
1,122 MHz |
1,185 MHz |
+23.5 |
|
Batam |
116.00 MHz |
1,131 MHz |
1,194 MHz |
No |
|
Johor |
112.70 MHz |
1,098 MHz |
1,161 MHz |
Out of band |
|
Bintan |
114.80 MHz |
1,119 MHz |
1,182 MHz |
No |
While some of the signals shown in the above example can be identified, many cannot:
-
There are narrow band signals at the following frequencies: 1,180 MHz, 1,184 MHz, 1,190 MHz, 1,195.5 MHz, 1,200 MHz, and 1,203 MHz. These signals cannot be identified.
-
There are wide band signals at the following frequencies: 1,172 MHz, 1,176.50 MHz (very near to L5), and 1,181,5 MHz.
These signals will be discussed in a later section.
Example 2
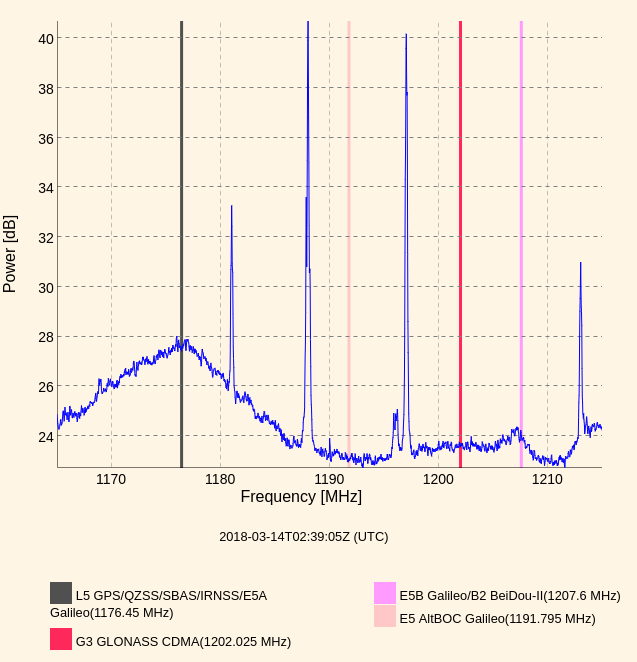
This example shows the L5 band in Westminster CO, USA. The table shows the local VOR and DME (TACAN) frequencies for the Westminster CO vicinity. The only Westminster signal that is unidentified is a small band at a level of 25dB at a center frequency of approximately 1,195MHz.
Unlike the Singapore L5 plot there is not obvious band of frequencies at L5 but the Westminster plot shows a curious triangle shape centered on the L5 center frequency. More on this topic in a later section.
|
Site |
VOR channel |
DME Rx channel |
DME Tx channel |
Visible (~dB) |
|---|---|---|---|---|
|
Mile High |
114.70 MHz |
1,118 MHz |
1,181 MHz |
+33.0 |
|
Denver |
117.90 MHz |
1,150 MHz |
1,213 MHz |
+31.0 |
|
Falcon |
116.30 MHz |
1,134 MHz |
1,197 MHz |
+40.0 |
|
Jeffco |
115.40 MHz |
1,125 MHz |
1,188 MHz |
+41.0 |
|
Gill |
114.20 MHz |
1,113 MHz |
1,176 MHz |
No |
Additional signals to take note of are the amateur radio satellite uplink band from 1240 to 1300 MHz. There can also be amateur radio terrestrial digital TV experimentation inside this BW.
Example screen with interference
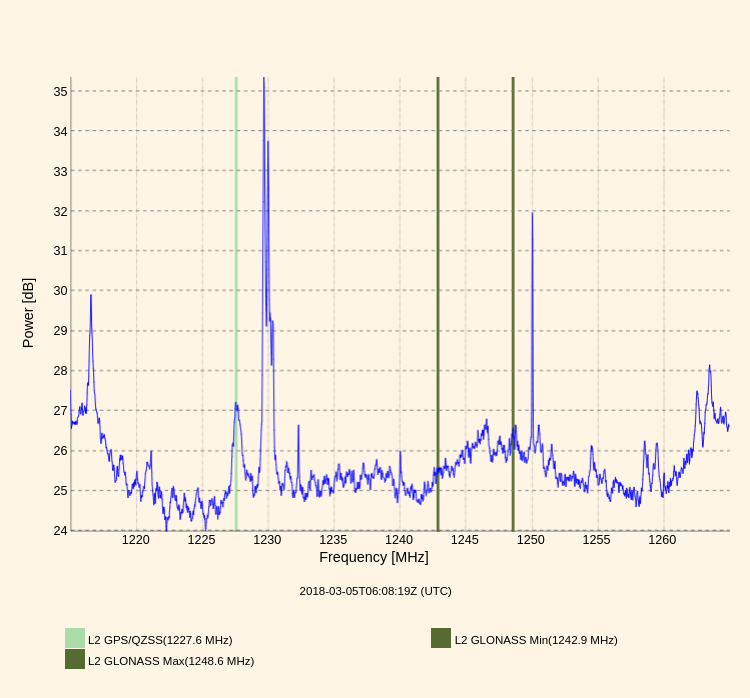
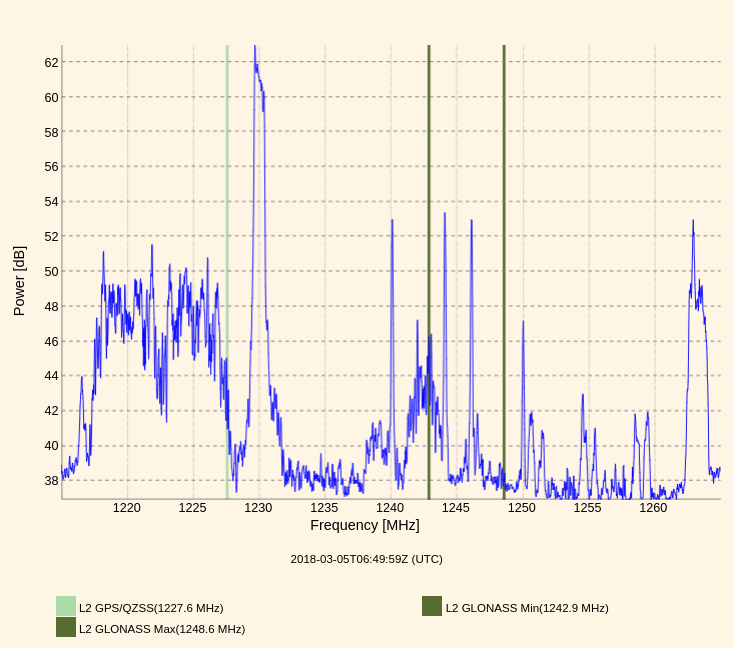
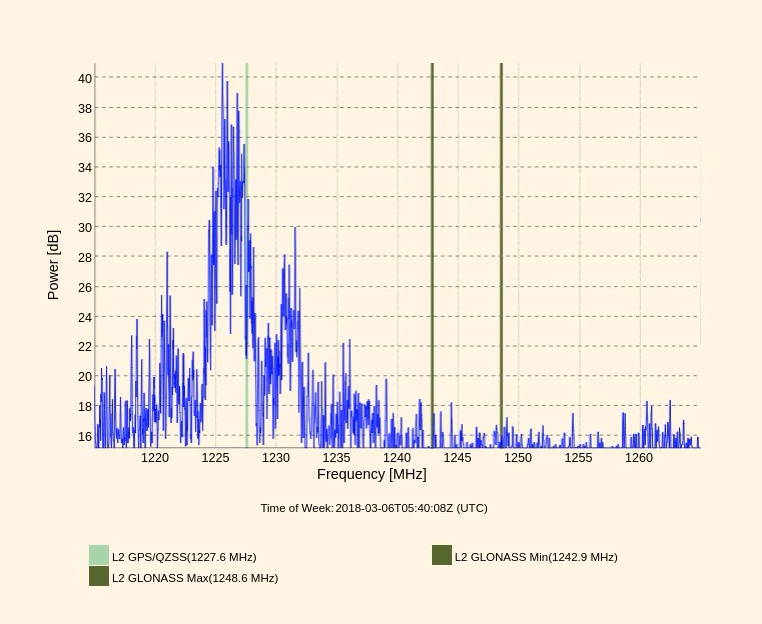
This example shows the "Filtered Spectrum" of the frequency band of L2 in Singapore with signal interference on GPS L2. GPS L2 is experiencing multiple cycle slips during most epochs.
The example shows various signals:
-
There are narrow band signals at 1,250 MHz and 1,232.5 MHz.
-
There are wide band signals at 1,217 MHz, 1,227.6 MHz, and 1,230 MHz.
-
The 1,227.6 MHz signal, while in band for GPS L2, does not seem large enough to cause a problem, more on this is a later section.
Switching from filtering mode to "Max Hold" shows a very different display:
With the Filtering mode is in Max Hold, a large wideband signal appears from ~1,217 to 1,27 MHz. This very well could be causing the cycle slips on GPS L2:
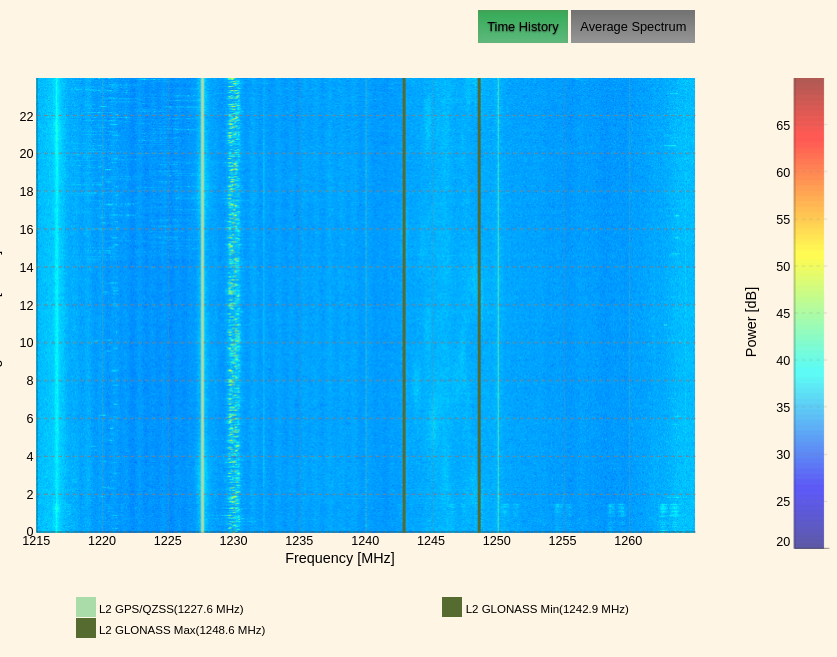
A look at the Spectrum History in the figure below shows only the signals at 1,230 MHz and the smaller one at 1,228 MHz. The wide band interference at ~1,217 to 1,27 MHz does not show up because it appears to be averaged out. This indicates that it is some sort of transient signal that gets averaged out of the waterfall and filtered display. The most likely type of signal that would behave this way is radar.
The spectrum analyzer was then placed in No Filtering mode and a screen recording application was used to record to video the spectrum analyzer display for approximately 3 minutes. The following figures were taken from this recording.
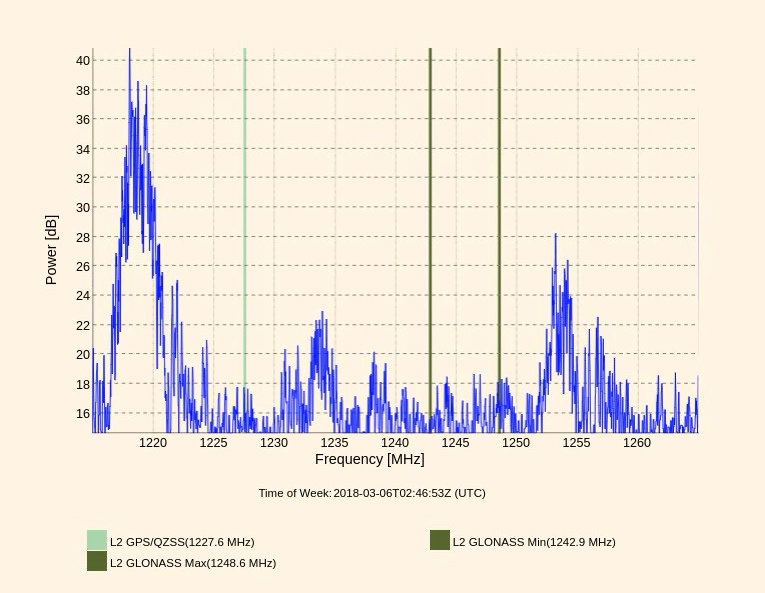
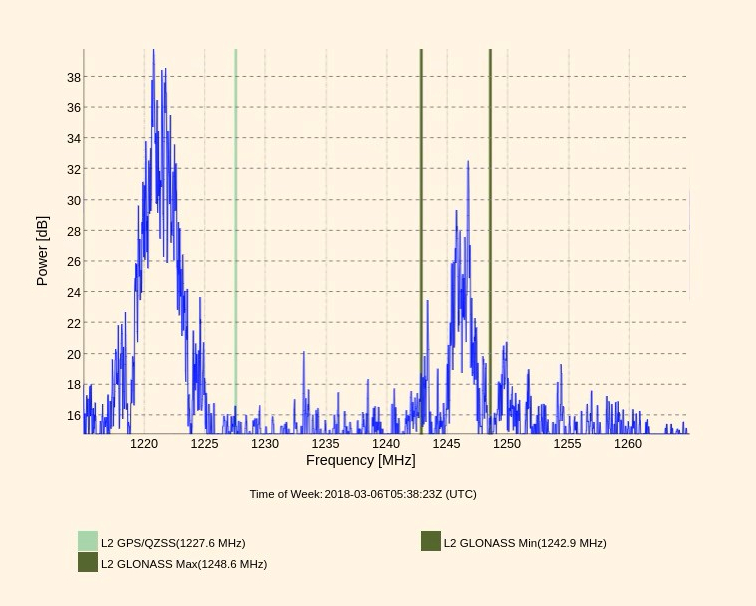
The sequence of screen captures shown above shows the radar pulse from ~1,170 to 1,130 MHz. Note each screen captures shows only a portion of the pulse and not the entire pulse. This behavior is normal due to the 1% sample set that the spectrum analyzer has to work with.
Visibility of GNSS bands
In some cases it is possible to see the GNSS bands in the spectrum analyzer, but this comes with a few caveats.
The noise, per unit BW, as computed from Boltzmann's Constant and ambient temperature is:
Converting this value to dBm:
This value tells us that the noise floor is -174 dBm/Hz. To find the actual noise floor of a particular signal the BW of that signal must be added (in dB) to the -174 dBm value. The noise floor for various GNSS signals is given in the following table along with the minimum expected signal level at the earth's surface of that particular signal.
|
Signal |
Center Freq (MHz) |
BW (MHz) |
Noise Floor (dBm) |
Expected Minimum Signal Level (dBm) |
|---|---|---|---|---|
|
GPS L1 C/A |
1575.42 |
2.046 |
-111.0 |
-128.5 |
|
GPS L1C BOC |
1575.42 |
2.046 |
-111.0 |
-127.0 |
|
GPS L1 P(Y) |
1575.42 |
20.46 |
-100.9 |
-131.5 |
|
GLL E1 OS |
1575.42 |
4.092 |
-107.9 |
-127.0 |
|
QZSS L1SAIF |
1575.42 |
2.046 |
-111.0 |
-131.0 |
|
QZSS L1 C/A |
1575.42 |
2.046 |
-111.0 |
-128.5 |
|
QZSS L1 BOC |
1575.42 |
4.092 |
-107.9 |
-127.0 |
|
SBAS |
1575.42 |
2.046 |
-111.0 |
-131.5 |
|
GPS L2 CM+CL |
1227.60 |
1.023 |
-114.0 |
-134.5 to 131.5 |
|
GPS L2 P(Y) |
1227.60 |
20.46 |
-100.9 |
-130.0 to 134.5 |
|
QZSS L2 CM+CL |
1227.60 |
1.023 |
-114.0 |
-130.0 |
|
GPS L5 I+Q |
1176.45 |
20.46 |
-100.9 |
-127.9 |
|
QZSS L5 I+Q |
1176.45 |
20.46 |
-100.9 |
-127.9 |
|
GLL E5a I+Q |
1176.45 |
20.46 |
-100.9 |
-125.0 |
|
NavIC L5 C/A |
1176.45 |
2.046 |
-111.0 |
-129.0 |
|
NavIC L5 R-BOC |
1176.45 |
4.092 |
-107.9 |
-125.0 |
|
SBAS L5 |
1176.45 |
2.046 |
-111.0 |
-131.5 |
|
GLN L1 |
1598.1 to 1605.4 |
1.023 |
-114.0 |
-131.0 |
|
GLN L2 |
1242.9 to 1248.6 |
1.023 |
-114.0 |
-127.0 |
|
GLL E5b |
1207.6 |
20.46 |
-100.9 |
-125.0 |
|
GLL E6 D+P |
1278.75 |
10.23 |
-104.0 |
-125.0 |
|
GLL E6 BOC |
1278.75 |
20.46 |
-100.9 |
-125.0 |
|
QZSS LEX |
1278.75 |
10.23 |
-104.0 |
-125.7 |
|
BD B3 I+Q |
1268.52 |
20.46 |
-100.9 |
-133.0 |
|
BD B2 I |
1207.14 |
4.092 |
-107.9 |
-133.0 |
|
BD B2 Q |
1207.14 |
20.46 |
-100.9 |
-133.0 |
|
BD B1 I+Q |
1561.098+ 1589.742 |
4.092 |
-107.9 |
-133 |
For all SV signals listed above, the minimum expected reception level at earth's surface is below the ambient noise floor, which means that signal will not be visible on a spectrum analyzer. This reasoning holds only for individual satellites, not for multiple SVs using the same channels. In general, SV signals will be visible on the spectrum analyzer if the following conditions are met:
-
The SV BW of the lobe in question is less than or equal to 4.092 MHz
-
There are multiple SVs using that same signal in view
-
In most cases the actual ground level received signal strength is several dB higher than the published minimum
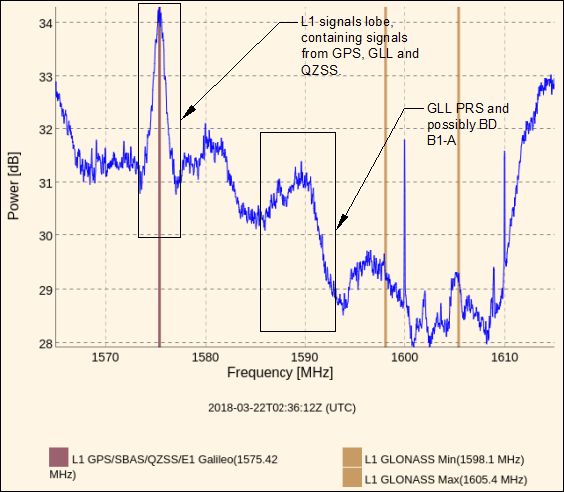
Multiple SVs using the same band width has the effect of raising the noise floor in the same geometry as the signal envelope of that particular band width. If enough SVs are present, this envelope will rise out of the noise.
As an example, consider this figure with an annotated display of L1 frequencies in Singapore:
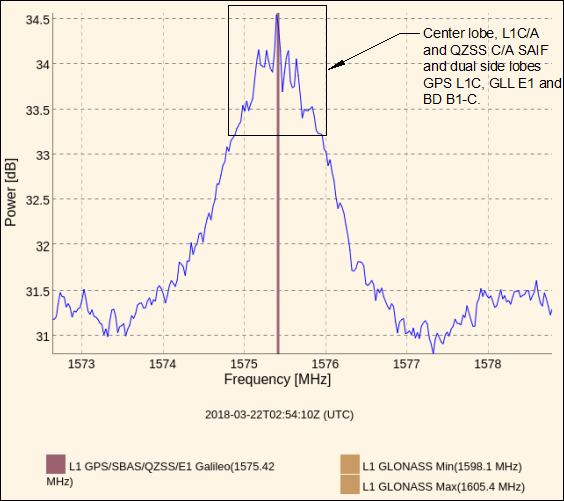
This figure shows the expanded view of the main L1 lobe from the figure above:
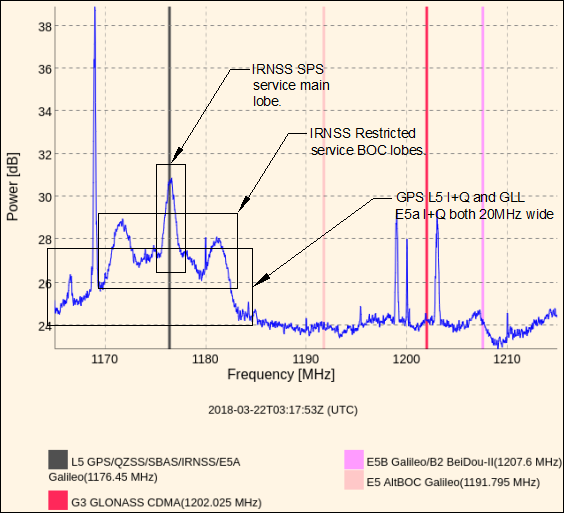
This figure shows the L5 lobe as seen in Westminster CO. As this display is from Westminster USA, no QZSS or URNSS signals are present meaning the GPS and GLL on their own are able to rise above the noise, which is interesting considering the signals are 20.46 MHz wide. GPS and GLL have both I + Q signals.
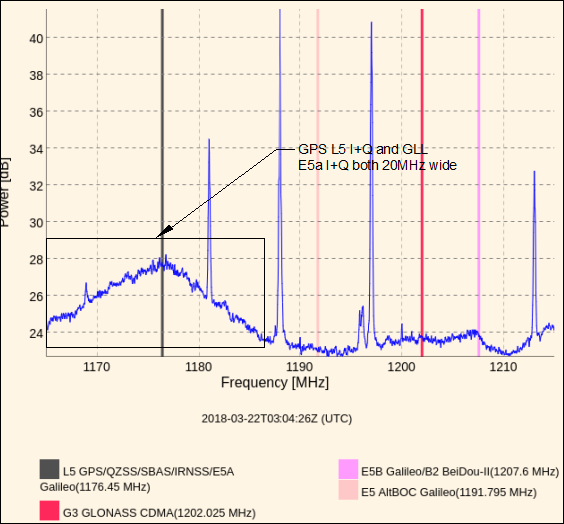
The same L5 display from Singapore shows something slightly different. The annotations on the next figure show the following:
-
The main lobe of L5 GPS and GLL E5a I+ Q, which is the same as in Westminster CO
-
The main lobe of L5 QZSS I+Q which is the same as the GPS GLL signals
-
The main SPS lobe of the NavIC signals which are not visible in Westminster CO
-
The main lobes of the restricted NavIC BOC lobes also not visible in Westminster CO
Notice how in the previous figure and the next figure nothing appears visible for E5B, E5 BOC and G3 GLL. There are several reasons for this:
-
The spreading of the signal is over 20 MHz
-
There are not enough SVs to raise this large BW above the noise floor
